OmniGraphSketcher
Usually when plotting graphs of captured data series I use gnuplot – it’s easy to get programmatically generated data into, and produces clear, readable results. But when today I wanted to generate a quick graph of memory usage whilst tracking a memory leak, and I discovered both I didn’t have gnuplot installed on my Mac Pro and my macports install was unhappy (yet again…), I decided to see what else might be a usable alternative, and perhaps somewhat more Mac native.
In the end I found myself playing with OmniGraphSketcher – this is a small app that doesn’t do much but let you plot data, draw curves that fit the data, and perhaps annotate it a little. An excellent tool to complement Keynote or the like, but I was surprised how easy it was to cut and paste (or indeed pipe to pbcopy and paste) simple data series into a graph and quickly see what you wanted:
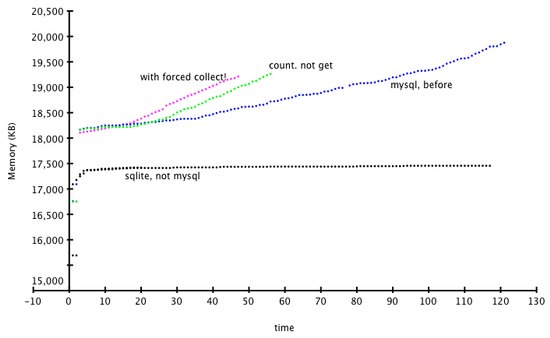
Not the best looking graph, but it did what I wanted quickly and simply (it would appear that the python mysql bindings leak memory somewhere, alas). I had a script that would save a list of samples, one per line, which I could then paste straight into OmniGraphSketcher, and see the results. It’s not nearly as useful as gnuplot generally, but for a quick Mac friendly app, it’s not bad, particularly if you then want to put those graphs into a presentation with annotations.
- Next: Lunch time in the Garden
- Previous: Zero S electric motorbike, available now
- Tags: geek