Fun with Wattson and Holmes
Laura blogged a while back about the Wattson home power monitoring unit we have from DIY Kyoto. One of the nice things about the Wattson, other than being prettier than your average power monitor, is that it has a USB port, and with the Holmes software you can download your power usage history and see it all nicely graphed.
However, as nice as the Holmes software is, I wanted the raw data to play with, for example, to display it on my CODA Display. After a little prodding I discovered that, at least on Mac OS X, Holmes saves the raw data into a fairly easy to understand SQLite database. Thus it was but the work of a moment for our hero to write a Python script to access and manipulate the power data. Thus Wattson.py. An example use of the script might look something like:
import time
import Wattson# create a Wattson object that’ll contain the power data stored on this machine
w = Wattson.Wattson()# create a new time range
start = time.strptime(“2007-06-01”, ”%Y-%m-%d”)
end = time.strptime(“2007-06-02”, ”%Y-%m-%d”)# Create another Wattson object that contains just the data for that subrange
v = w.get_sub_range(start, end)# Write the data out to a CSV file
v.write_to_csv(‘data.csv’)
That code creates a CSV file that contains the power information for the 1st of June. When put through Numbers I get a pretty graph like this:
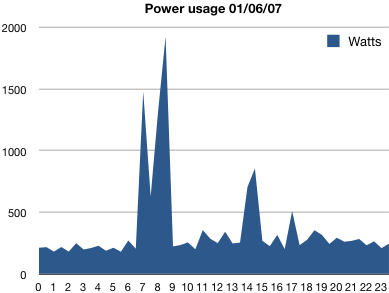
Here you can see when we got up in the morning and some activity in the afternoon. You can also use the Wattson object to get at the data values for a given time range, get averages, and so on. Nothing rocket science, but it’s nice to have the data to play with. Now I just need an automated way to prod Holmes into regularly downloading the data for me…
- Next: You can run but you can't hide
- Previous: Dirk Gently shortly
- Tags: Geek